Creating A Pattern File Using Proximity Correction
If you haven't, I recommend you read the LayoutBEAMER manual sections that cover their implementation of Proximity Effect Correction. They've done a good job of documenting the process there.
When preparing the file, there are many options. Here I describe a very basic Shape Correction, such as shown on the intro page above.
In addition to creating an exposable binary pattern file in JEOL 52v3 format, ie, a .v30 file, the EXPORT module also creates a .jdi file with the same name as your pattern file. This file contains the actual relative dose values for each exposure index (Shot Rank). The .v30 file does not contain actual doses, but rather each shape is tagged with some integer value ranging from 0 to 255, these are called "Shot Ranks". The actual dose used to expose each shot rank is assigned in your Dose Modulation Table of your JDF file at run time.
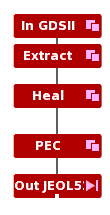
Example LayoutBEAMER Flow using Proximity Effect Correction
The flow itself is quite simple; just add a PEC module between the Heal and Export JEOL steps.
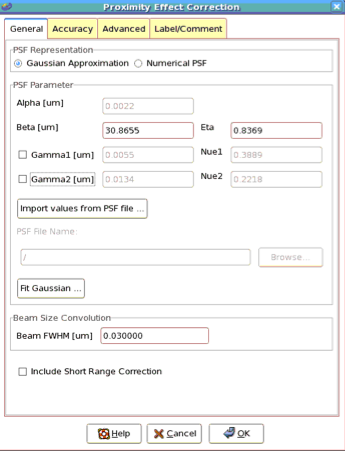
The PEC module has many variables and options, this shot shows a very simple, but often highly effective correction. In this case, I'm only correcting for long-range scattering on a silicon substrate. In general, for pattern with minimum feature sizes larger than ~50 nm, correcting only long-range scattering gives a perfectly fine result.
When you execute this correction, which for complex patterns may compute for some time, the result will be your pattern, but subfractured typically into many more smaller shapes that not using PEC. The exact parameters which control the subfracturing are under the "Advanced" tab on the PEC dialog.
Consider this subsection of pattern: 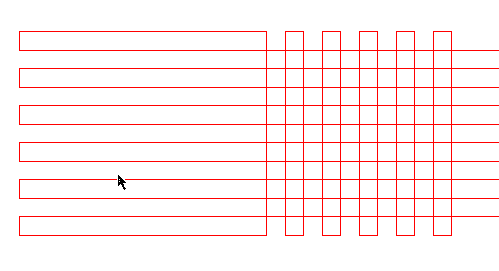
After PEC, this region is subfractured into many more shapes. 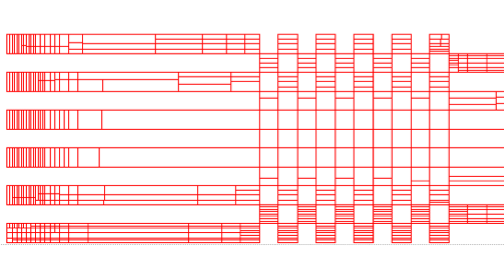
By choosing "Color By Dose", and scaling the color range appropriately by choosing "Get Limits From Layout", in this case, you see that the computed dose assignments range from 0.99 to 1.77 of nominal base dose. 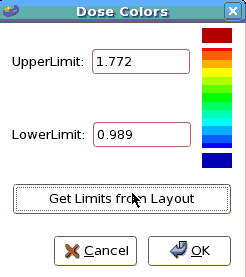
If you then view the pattern with Fill enabled, you see the dose variations displayed as color variations. In this figure, you also see a "Pick" measurement, in which two shapes were "Pick"ed, by Double-Right-Click, an among the Shape information displayed, notice the last value, labeled "E:" is the assigned dose (Energy) to that shape. The two shapes picked show the range from a relatively isolated corner to a central shape. 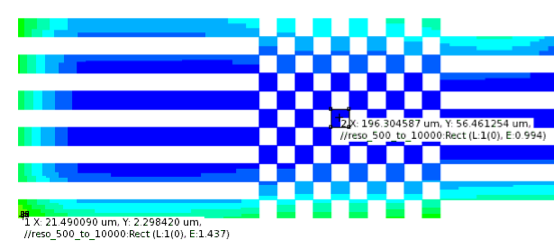
The dose information in the pattern file, is a relative to some base dose, and furthermore, the actual relative doses are not contained in the .v30 pattern file, but are in a separate file created during the proximity correction process called a JDI file, which is described on the next page.